 The Duck Curve
Berkeley Lab: batteries paired with 37% of new US home solar in 2025
California's attachment rate rose to 74% and the other states' combined rate to 17%, while median home battery discharge power nearly doubled to 11.4 kW, which the lab attributes to the Powerwall 3.
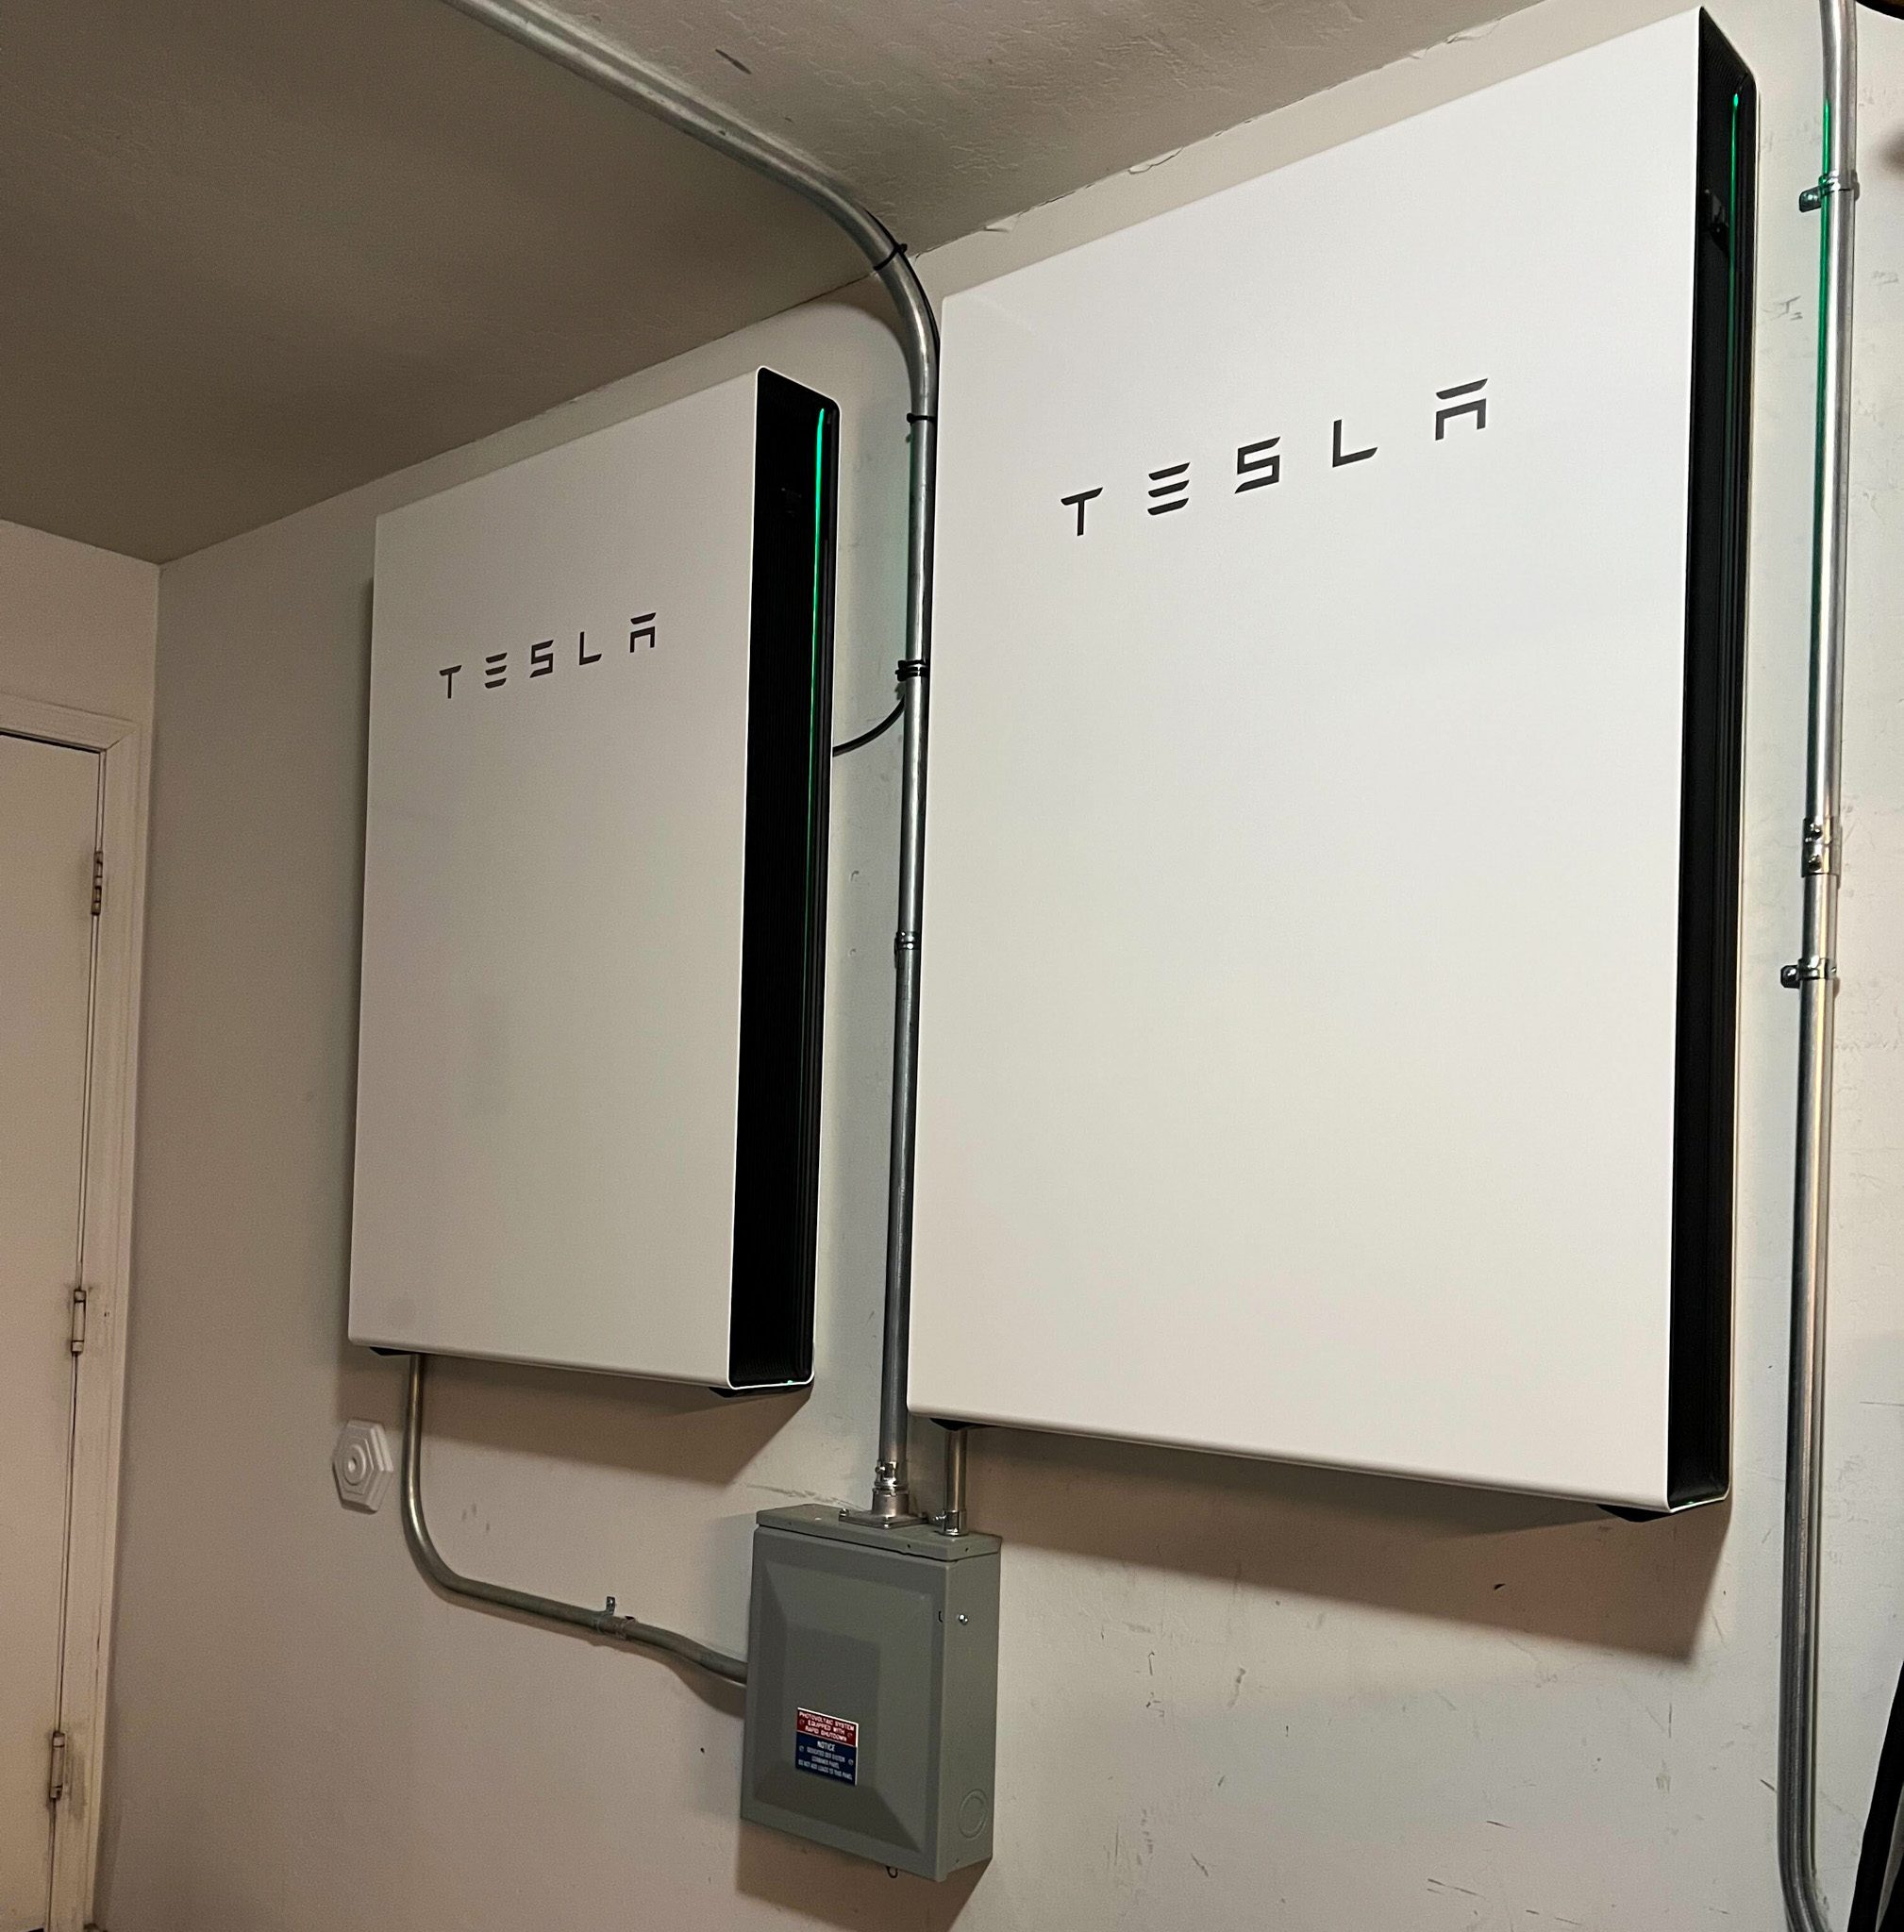
More than a third of the residential solar systems installed in the US in 2025 came with a battery. The share reached 37%, up from 25% in 2024, according to Lawrence Berkeley National Laboratory's U.S. Distributed Solar and Storage: 2026 Data Update, published in August 2026. California went from 58% to 74%, and all other states combined went from 7% to 17%.
The dataset behind those numbers covers roughly 5.3 million distributed solar systems, including 450,000 installed in 2025, which Berkeley Lab says is 93% of the US market for the year. Its attachment rate counts batteries installed together with new solar. Batteries added later to an existing array, and stand-alone home batteries, are outside it, so the rate measures how often new solar arrives with a battery, not how many home batteries went in.
California leads; the other states combined more than doubled
California still drives most of the national number, but the lab's state chart shows large upticks in Arizona and Texas in 2025, and Hawaii and California kept the highest residential attachment rates. Across the other states as a group, the share of new home solar arriving with a battery more than doubled in a single year, though in percentage points the gap with California still widened, from 51 to 57 by our arithmetic.
The California curve has a policy shape. The net billing tariff the California Public Utilities Commission adopted on December 15, 2022 for new rooftop solar customers of Pacific Gas and Electric, Southern California Edison and San Diego Gas & Electric credits their exports at their value to the grid, and the commission said the decision incentivizes customers to install battery storage "so they can store solar electricity produced in the daytime and export it in the evening, when the grid needs it the most for reliability and displacing fossil fuels." The tariff applies to customers who applied to interconnect on or after April 15, 2023, per the CPUC. The decision also gave extra bill credits to residential customers adopting solar over the following five years, so installers could shift gradually from solar-only to solar-plus-storage sales; by 2025, three in four new California residential systems already carried a battery. (The evening hours in question are the steep end of the duck curve.)
The federal credit, meanwhile, paid for panels and batteries alike. The Residential Clean Energy Credit covered 30% of the cost of qualifying home clean energy property installed from 2022 through December 31, 2025, including solar and, beginning in 2023, battery storage of at least 3 kWh, and per the IRS it is not available for property placed in service after that date. That makes 2025, the year Berkeley Lab's new data covers, the final year in which a homeowner could install a system and claim it.
Same energy, nearly twice the power
The batteries themselves held the same amount of energy and delivered far more power. Median residential storage capacity was 13.5 kWh in both 2024 and 2025, "the size of a single Tesla PowerWall," in the lab's words. Median discharge capacity went from 6.0 kW to 11.4 kW, which the lab attributes to "the release of the PowerWall 3 (with a much higher discharge capacity than previous models)." Its sizing figures rest mostly on California data, about 80% of the sample, though it says trends elsewhere are similar.
The difference matters because kW and kWh do different jobs: the energy figure sets how long a battery can run, the power figure how much of the house it can run at once. Tesla said in September that a Cybertruck can now back up a home alongside a Powerwall 3, which by its account extends home backup by more than three days: a claim about kWh.
The Powerwall 3 is also changing what goes on the roof. Module-level power electronics, the microinverters and DC optimizers that grew steadily as a share of residential systems until 2019 or 2020, dropped off substantially in 2025, which the lab calls "a stark contrast to longer term trends." It traces the drop to rising attachment rates and the shift to Powerwall 3 systems, "which do not readily allow the use of MLPEs in their typical DC-coupled configuration."
Price, permits and the non-residential market
The battery is not cheap. Among cash-purchase residential systems in 2025, median installed prices were $2.1 per watt of solar capacity higher for solar-plus-storage than for stand-alone solar, per the lab, with smaller differences for loan-financed systems. About 80% of that paired-system pricing data comes from California.
Battery systems now clear permitting faster than solar-only ones at the slow end. At the 80th percentile, residential solar-plus-storage went from permit application to permit issue in 21 days in 2025, down from 35 days in 2023, per Berkeley Lab; solar-only systems took 25 days, up from 9 days in 2000. The lab says paired systems' slightly shorter national timelines partly reflect where those systems are installed, and at the state level they were shorter in some states and longer in others.
Non-residential solar is further behind. Batteries were attached to 11% of US non-residential solar installs in 2025, up from 7%, with California's rate at 18% and all other states combined at 8%.
Outlook
The 2025 numbers cover the federal credit's final year, and the first 2026 figures still carry its tail. American Clean Power and Wood Mackenzie, counting on their own quarterly basis, reported a 45% national residential attachment rate in Q1 2026, up from 38% in Q1 2025, but the same release says the quarter's residential volumes were "buoyed by an overflow of installations initiated at the end of 2025 to capture the expiring Section 25D tax credit." The forecasts say more about the first full year without it. Wood Mackenzie's Allison Feeney expects a 5% residential storage contraction in 2026, far shallower than the 23% residential solar decline Wood Mackenzie and SEIA forecast in September, as The Duck Curve reported. If both forecasts hold, home storage shrinks less than home solar, and by our reading the next Berkeley Lab update would likely show a 2026 attachment rate above 37%. Rate design outside California is starting to reward the same hardware: Colorado Springs Utilities' new net metering options from April 1, 2027 include a demand charge, and the utility's chief planning and finance officer, Tristan Gearhart, told an August 25, 2026 public hearing that "a solar customer with a battery would be able to avoid the demand charge when selecting the Net Metering Demand Option," as The Duck Curve reported.
⚠ The Outlook extrapolates from American Clean Power and Wood Mackenzie's Q1 2026 residential attachment rate (a quarter their release says was buoyed by installations initiated in late 2025 to capture the expiring 25D credit) and 2026 residential storage forecast, and from Wood Mackenzie and SEIA's September 2026 residential solar forecast, all cited; those attachment figures are counted on a different basis from Berkeley Lab's, and the projection above 37% is The Duck Curve's, conditional on both forecasts holding.
Sources
Primary
- U.S. Distributed Solar and Storage: 2026 Data Update · Lawrence Berkeley National Laboratory
Supporting
- CPUC Modernizes Solar Tariff to Support Reliability and Decarbonization · California Public Utilities Commission
- Residential Clean Energy Credit · Internal Revenue Service
- U.S. Energy Storage Market Q1 2026 Sets Records Across Sectors · American Clean Power Association / Wood Mackenzie
- NEM Revisit · California Public Utilities Commission
Copies of cited sources are retained where available. If a link no longer resolves, request a copy at contact@theduckcurve.com.