 The Duck Curve
Solar and storage saved Texas $3.55B and California $2.5B, SEIA says
The trade group credits savings from the whole drop in summer wholesale prices since 2021, 42% in ERCOT and 51% in CAISO, to solar and batteries; PG&E and SCE bill prices rose 22%.
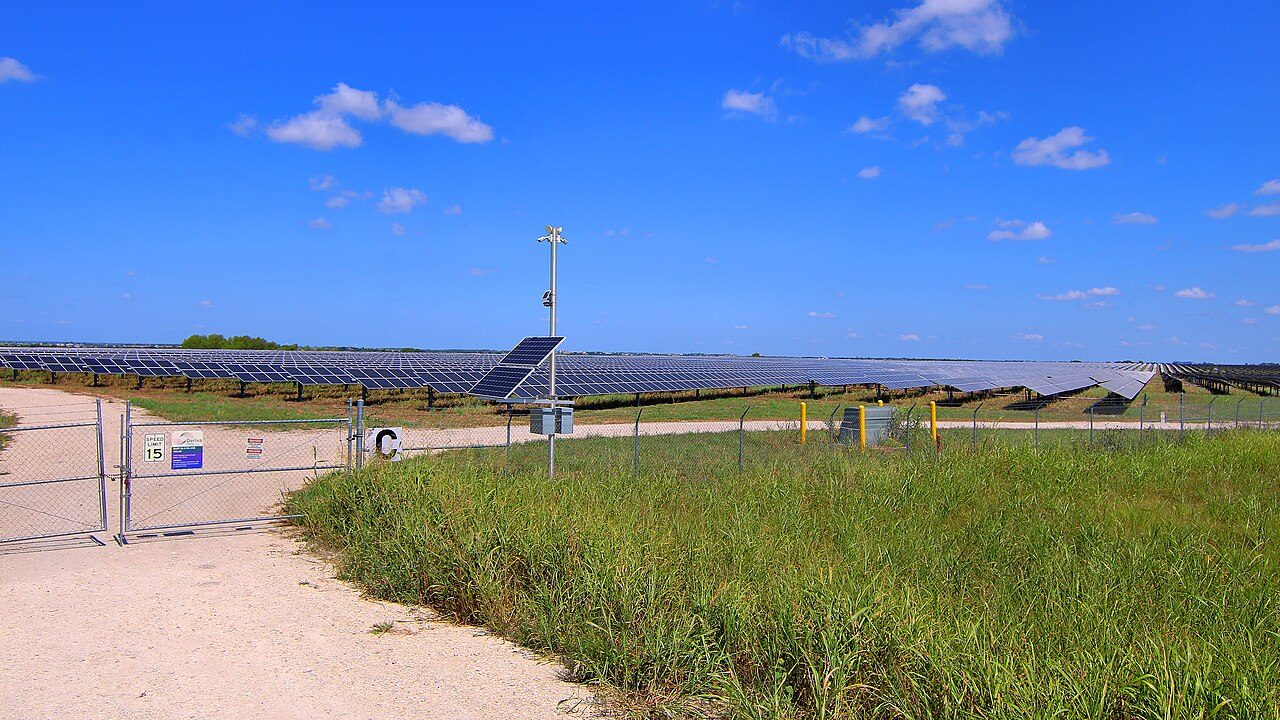
Solar and batteries saved Texans about $3.55 billion and Californians about $2.5 billion on wholesale power in summer 2026, according to an analysis by the Solar Energy Industries Association released October 22. The trade group compared June through August 2026 with the same months of 2021 and found the generation-weighted average day-ahead price down 42% in ERCOT, from $54.97/MWh to $31.77/MWh, and 51% in CAISO, from $77.54/MWh to $38.32/MWh, both in 2026 dollars.
The two grids got there under different loads. ERCOT used 30.1% more power than in summer 2021, per SEIA, and on July 22 it peaked at 91.1 GW, a record by the Energy Information Administration's count. CAISO used 2.5% more, and its 2026 high of 50.0 GW, on September 9, fell short of the 51.1 GW record it set in 2022. SEIA's report page opens with the two states meeting "record high electricity demand"; on EIA's peak figures, that describes Texas.
Over the same five years, SEIA says, solar generation rose 421% in Texas and 90% in California. Battery storage, counted in energy terms, grew from 1.0 GWh of installed capacity to 33.1 GWh in Texas and from 8.1 GWh to 62.0 GWh in California through the first half of 2026, and batteries now provide 6%-7% of daily energy use in CAISO and over 1.3% of energy in Texas. Peak prices fell further than the average: the summer-average peak went from $141.75/MWh to $59.69/MWh in CAISO and from $110.96/MWh to $57.30/MWh in ERCOT. SEIA ties the declines to solar and storage displacing "very expensive peaker generation" in more hours and setting the market-clearing price in more hours.
How the savings are counted
The dollar figures are SEIA's, and the analysis does not show the arithmetic behind them. It describes them as savings "due to the drop in wholesale energy price," under headings that credit the same sums to solar and storage, so the whole price decline is booked to the two technologies, though the release itself says their growth "helped drive down" prices. The analysis does not discuss fuel prices, and gas moved too. The national Henry Hub spot price averaged about $3.72 per million Btu in June through August 2021 and about $2.94 in the same months of 2026, roughly 21% lower before inflation, by our arithmetic from EIA's monthly series. SEIA's comparison does not separate that effect from the solar and storage effect.
The direction of California's decline holds up in other data. In the day-ahead bilateral trades EIA republishes from ICE, on-peak power at the SP15 hub averaged about $75/MWh for June through August 2021 deliveries and about $34/MWh for 2026, by our arithmetic and before inflation. EIA's 2021 and 2026 files carry no Texas hub, so the ERCOT figures rest on SEIA's numbers alone.
California's headline decline comes in two sizes. SEIA's report page puts it at 40%, while the analysis and the release say 51%, which is what the analysis's own prices, $77.54 and $38.32, work out to. The methodology could use one more pass as well: it says the prices come from "XX individual nodes," while the chart footnotes list 19 ERCOT hubs and load zones and nine CAISO load zones.
Bills went the other way
Wholesale power is only the generation slice of a bill, and in California the other slices grew much faster. Using data from Heatmap and MIT for Pacific Gas & Electric and Southern California Edison, SEIA finds the generation portion of the average California bill price fell 10% between the two summers, while transmission rose 12%, distribution 51% and "other" costs, which include wildfire management, 90%. The overall bill price rose 22%. Across 11 Texas utilities, from AEP Texas Central to TNMP, generation fell 4%, transmission rose 17%, distribution rose 23% and other costs fell 5%, for a 3% rise overall.
By SEIA's own numbers, then, the average PG&E and SCE bill price rose 22% over a stretch in which California's average wholesale price fell by half. More increases are queued: electric and gas utilities asked regulators for a third-quarter record of $4.5 billion in rate increases in July through September 2026, CenterPoint Energy in Texas among them at $0.3 billion, per PowerLines' tally of requests.
SEIA aimed the analysis at the election calendar. "As the midterm elections approach, delivering affordable, reliable power is a priority that transcends party lines and Texas and California are proof that the growth of solar and storage is driving down prices," said SEIA CEO Tim Pawlenty.
Australia's market operator measures the mechanism SEIA describes. Battery charging or discharging set the National Electricity Market's spot price in 48% of dispatch intervals in the third quarter of 2026, up from 18% a year earlier, as average wholesale prices fell 27% year on year, AEMO reported on October 23. SEIA's analysis says solar and storage set the clearing price in more hours, without saying how many.
Sources
Primary
- Solar Energy and Battery Energy Storage Help Lower Power Prices: Evidence from California and Texas as electricity demand grows · Solar Energy Industries Association
Supporting
- PJM, ERCOT, and SWPP all set peak load records this summer · U.S. Energy Information Administration
- Henry Hub Natural Gas Spot Price (Dollars per Million Btu), monthly · U.S. Energy Information Administration
- Solar and Storage Saved Californians and Texans Billions in Energy Costs this Summer · Solar Energy Industries Association
- ANALYSIS: Solar and Storage Growth Drives Down Summer Wholesale Electricity Prices by 42% in Texas and 51% in California · Solar Energy Industries Association
- Wholesale Electricity and Natural Gas Market Data (ICE daily prices) · U.S. Energy Information Administration
Copies of cited sources are retained where available. If a link no longer resolves, request a copy at contact@theduckcurve.com.