 The Duck Curve
CEC field tests find 96% of California public chargers working
Credit and debit cards failed on 34.4% of first payment attempts, and the fast-charging operational rate leans on Tesla, whose ports were about 60% of the fast-charging ports testers reached.
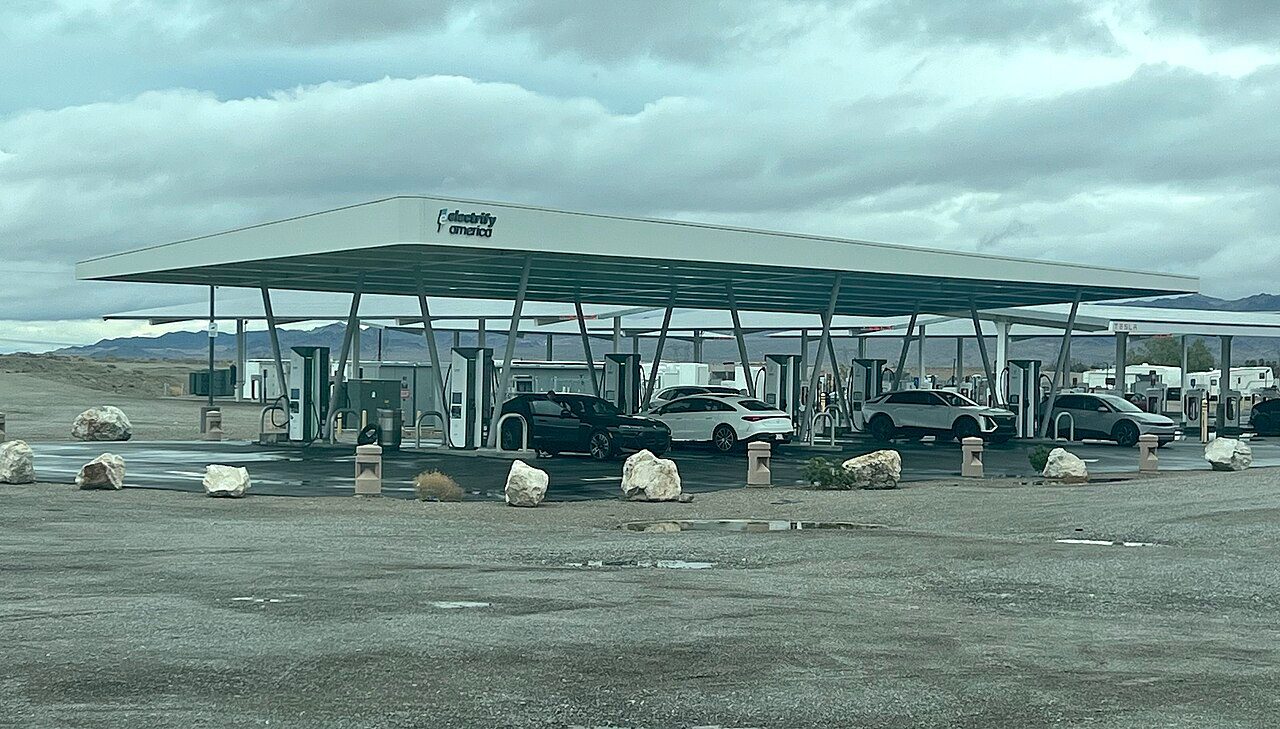
About 96% of California's public charging ports worked when testers from the University of California, Davis showed up, according to a California Energy Commission staff report dated November 2026: 96.2% of Level 2 ports and 96.4% of DC fast-charging ports were operational at the time of testing. Paying was the weak link. Credit and debit cards failed on the first attempt 34.4% of the time, against 2.3% for plug-in payment, where charging is authorized when the car is connected.
Between January 2024 and February 2026, UC Davis testers plugged a car in at 3,571 ports (1,817 Level 2 and 1,754 fast) and inspected 12,586 more without plugging in, out of a state total the report puts at more than 216,000 public and limited access ports through 2025. They stood in for data the commission does not have yet. Assembly Bill 2061, the 2022 law behind the report, told the commission to assess the uptime of charging infrastructure beginning January 1, 2025 and every two years after; this staff report is its interim assessment. Uptime needs continuous data from chargers, and the commission's EV Charger Data and Reliability Standards only took effect on April 1, 2026, with the first uptime data from publicly funded chargers expected at the end of 2026. What the testers measured is whether a port worked on the day of the visit, not how often it is down over a year.
A second measure, the successful charge attempt rate, asks whether a car actually charged at a port that was working. It came in at 93.1% for Level 2 and 94.0% for fast chargers. The report reads both as improvements. It sets its operational rates of about 96% against earlier studies with rates as low as 72.5%, the share of the time Bay Area fast chargers charged the test car in a UC Berkeley study, and its charge success rates against earlier fast-charger figures of 77% to 86%. Many of those studies, it argues, combined broken ports and failed sessions into one score. Its conclusion stays hedged: "Although methodologies differ, these results, when compared to previous studies, suggest the reliability of California's publicly accessible charging network may have measurably improved in recent years."
Location made little difference. Gaps between disadvantaged or low-income communities and the rest ran 0.3 to 1.2 percentage points, and between rural and urban areas 0.1 to 0.8 points, within the margin of error at a 99% confidence level. The averages also leave out the ports nobody could reach: testers could not get to 1,575 Level 2 and 615 fast-charging ports, and nearly 9% of all Level 2 and 7% of fast-charging ports were obstructed, by anything from construction and dumpsters to parked gasoline cars.
The network behind the average
Tesla's fast chargers were operational at 99.6% of the 4,655 Tesla ports testers reached, about 60% of the 7,705 fast-charging ports in the operational count by our arithmetic. Charge success, measured only in the plug-in tests, was 98.3% across 867 operational Tesla ports, about half of the 1,712 in that count. The report itself leaves the networks unnamed: it credits the largest fast-charging network with those same two rates, against averages of 92.1% and 89.7% for all other networks, and says the leaders in both charger classes raised the statewide averages. The names come from the spreadsheet published with it.
The other named fast-charging networks sit well below it. Per the spreadsheet, Electrify America came in at 93.5% operational across 602 ports and 94.2% charge success across 171, EVgo at 92.7% across 898 and 88.3% across 266, and ChargePoint's fast chargers at 90.6% across 650 and 92.6% across 190. On Level 2 the leader is ChargePoint: 97.0% operational across 5,521 of the 8,452 Level 2 ports reached, and 96.5% charge success across 1,215 of the 1,768 in the plug-in count, against 94.9% and 85.6% for all other networks. Even without the largest network, the report says, reliability in its data exceeded what past studies reported, "though the variance among charging network providers shows clear room for improvement for lower-performing networks."
Paying is the hard part
Card readers were the least reliable way to pay. The figures cover the first method each tester tried: testers were assigned a payment method for each plug-in test, and across 3,525 first attempts in the spreadsheet, 17.7% failed. Cards failed 380 times in 1,104 tries, and how the card was used mattered: per the spreadsheet, swipes failed on 59.2% of first attempts, chip cards on 52.1% and tap on 26.7%. Swiping a card failed more often than it worked. Apps, membership cards, QR codes and other methods failed 14.0% of the time, and plug-in payment 19 times in 817 attempts.
In most cases testers eventually got another method to work, in many cases after cycling through several. The report notes that drivers "may not have access to all the payment types available to UC Davis testers." The card gap, it says, merits further study; possible explanations include weather-related failures, poor software integration with payment terminals, and terminals on separate, inferior cellular or other connections. It also cautions against reading too much into plug-in payment, since the vast majority of those tests involved one large network using its own vehicles.
The 97% rule is a different test
The commission's own performance standard does not use either of these numbers. Under the regulations the Office of Administrative Law approved in part on March 10, 2026, effective April 1, publicly or ratepayer funded chargers installed on or after January 1, 2024 must maintain a minimum annual average uptime of 97% for each calendar year of their first six years. AC Level 2 chargers are exempt, along with fleet, private residential and several other classes. The bar is a fast-charger rule counted in minutes of downtime across a year; the field test checked ports on a single visit, and the report says it does not determine uptime.
That makes 96.4% a snapshot rather than a near miss. Staff will begin collecting the time-series data the regulations require starting in late 2026, the report says, and those data will be the basis of the first official uptime assessment under AB 2061.
Sources
Primary
- Results of Field Tests of California's Electric Vehicle Charging Network Conducted Under Assembly Bill 2061 (CEC-600-2026-034) · California Energy Commission
Supporting
- OAL Notice of Approval In Part & Withdrawal in Part of Regulatory Action - Tracking & Improving Reliability of Electric Chargers (TN 269175) · California Office of Administrative Law (docketed by the California Energy Commission, 22-EVI-04)
- Appendix B: Data (CEC-600-2026-034-AP-B) · California Energy Commission
Copies of cited sources are retained where available. If a link no longer resolves, request a copy at contact@theduckcurve.com.